
Finding the types of incidents that affect performance, the COVID lock down experience
A case study in partnership with Greater Anglia
“… The modelling has helped us work through a very complex system to understand the individual levers we have to use to deliver change”
Marc Ware, Performance Manager, Greater Anglia
The challenge
Greater Anglia’s performance improved from 67% station stop on-time during February, to 90% in July 2020 during the COVID-19 lockdown. What was driving this improvement, could it be sustained when service levels and passenger numbers increase again?
What we did
Greater Anglia’s performance team working with Risk Solutions identified a range of changes to the operating railway due to COVID. We modified model inputs to replicate these, including reducing; passenger numbers (and associated passenger related delay incidents), the number of lineside and network management incidents, service frequency including freight trains and weather-related incidents. Finally, we combined all these together.

What we found
Individually each change we introduced resulted in improvements in performance. Removing services from the timetable had the greatest effect producing a 12% improvement in on-time station stops.
When combined, these measures considerably improve performance (17%), however, the effect is less than the sum of improvements due to individual changes. The combined changes result in 83% station stop on-time compared to the 90% improvement observed in July.
The results demonstrate the complexity of the rail system, with many interdependencies interacting in ways that are difficult to predict. The improvements during the COVID pandemic are a result of many changes to services, passenger numbers, maintenance interventions etc interacting with one another.
It is difficult to see how the improved performance can be sustained once operating conditions return nearer to normal. The modelling suggests that the most fruitful approach would be to focus on reducing sub-threshold delays, working collaboratively with partners in other operating companies and Network Rail.
SaviRPM provides a powerful tool to navigate the complexity, structuring conversations and exploring solutions.
“this adds another dimension to our insights, it is lifting the lid on a dataset that we had, but didn’t quite know what it meant"
Keith Palmer, Head of Performance & Planning, Greater Anglia
Using SaviRPM
- We set up SaviRPM for the Greater Anglia operating area, almost 500 modelled TIPLOCs (including 178 stations) and over 3000 timetabled services (around 1,600 Greater Anglia).
- We calibrated the model against real world data, in an iterative process with the performance team. We achieved modelled delays of 66.4% on time station stops for Greater Anglia services running under the December ‘19 timetable compared to 67.1% real world on-time – creating a robust baseline for our explorations.
- We used interactive visualisations to identify areas of poor model performance until we could reproduce real world results within one or two percentage points.
- We then modelled several scenarios representing the observed situation created by the COVID-19 lock down, e.g. reduction oin passenger numbers.
- We used the interactive visualisations to compare the scenarios and measured the likely improvement in performance from each situation, to explore the impact of COVID.
The modelled results
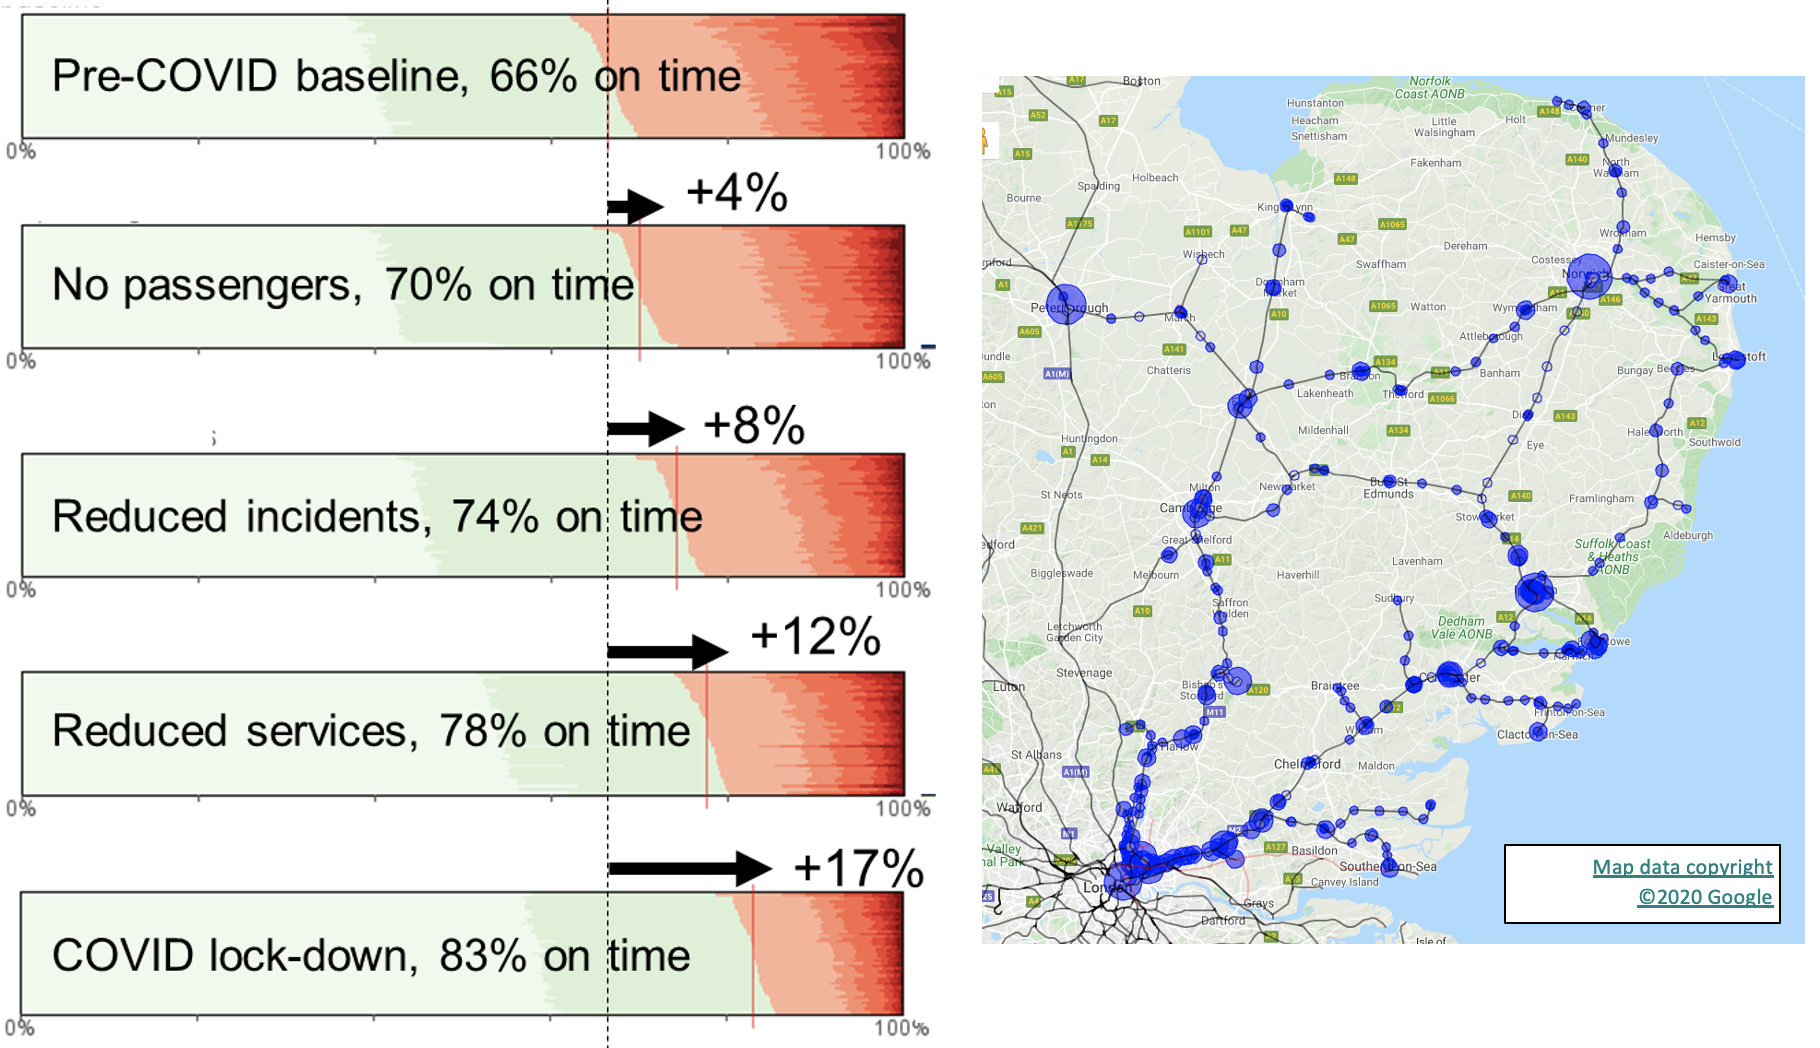
We compared the performance of each scenario using the station stop time to 1 minute performance measure
- Prior to COVID our modelled baseline performance was 66% of station stops on time
- Remove all passengers and their attributed and subthreshold delays... modelled performance improves by 4%
- Reduce number of attributed incidents (e.g. weather, lineside and network management) and subthreshold incidents... significantly improves performance by 8%
- Reduce service frequency including freight services... most significant single action, improving performance by 12%
- Combine all three to represent COVID lockdown... significant performance improvement of 17%

To find out more… and see the interactive visualisations in action
contact us: savi@risksol.co.uk