
Identify performance tipping points
A case study in partnership with Network Rail and Anglia route Train Operating Companies
The challenge
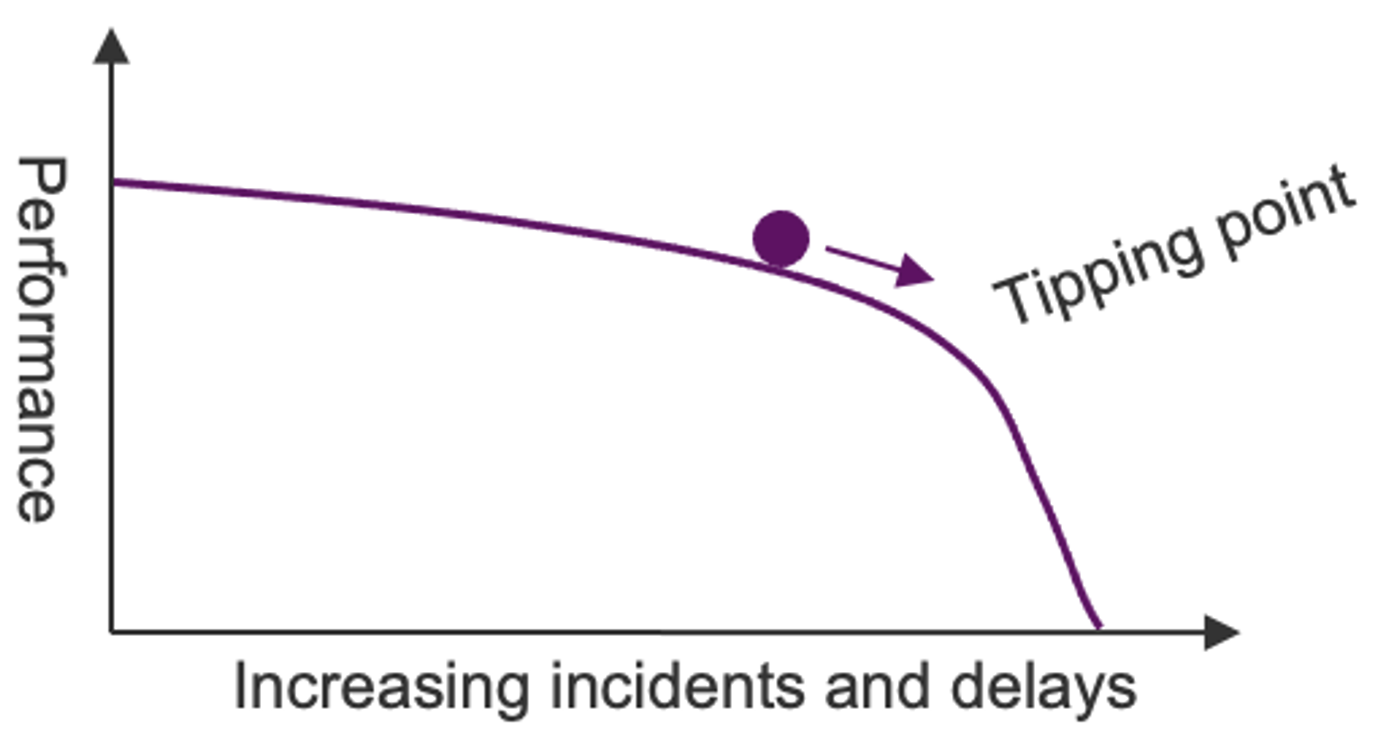
One of the characteristics of a complex system such as a rail network, is that it can exhibit tipping point behaviour (see for example the Magenta Book guidance on handling complexity). This occurs when the system is operating at a stable threshold, beyond which performance can change rapidly. If rail services are operating at or beyond a tipping point in performance, it is difficult to identify the causes and find effective solutions to improve performance.
If railway operators can avoid tipping points, by knowing the conditions that create them, then not only will service performance improve, but it will be easier to identify reliable solutions to any residual poor performance issues.
This project used rail system modelling to identify the conditions that cause performance tipping points for Anglia rail services. This knowledge was then used to identify the robustness of a new timetable design (May 2023) when facing increasing amounts of service delay, comparing the reliability of the new timetable with a known historic timetable (December 2019).
What we did
Explore conditions that cause tipping points in performance: First this project considered the things that might contribute to performance tipping points in a rail system; by modelling the performance of services with an increasing number of trains in a timetable and/or by increasing the number of incidents and delays caused to services, potentially creating congestion. Then analysing the modelled results to identify what was causing performance issues.
We modelled two parts of the Anglia rail network, with a significantly large number of modelling scenarios, gradually increasing the number of trains and the levels of delay. The modelled performance of each scenario was compared to observe the conditions that create significant drops in performance, so the conditions creating tipping points were identified.
What we found
Our exploration of tipping points has demonstrated that train service performance can suffer dramatically when there is:
- High utilisation of network capacity by services: this can be measured by the number of trains per hour using a route segment, and the available network capacity.
- Low system reliability: this can be measured by the frequency and duration of incidents that cause service delay.
- Particular combinations of service stopping patterns in a timetable: there is no simple metric to quantify this part of the puzzle, local knowledge and route planning experience deliver good performing timetables.
By modelling performance we found that tipping points exist, and that in peak periods in certain parts of the Anglia route, services can be experiencing high levels of congestion. They are beyond a performance tipping point, operating ‘in the red’.
The modelled performance of a rail service route can be helpfully shown in a table, with columns representing capacity utilisation (number of trains in a timetable) and rows representing system reliability (the number of incidents and delays to services). The tipping points are where performance rapidly reduces due to a combination of high network utilisation and/or a less reliable system (red cells).
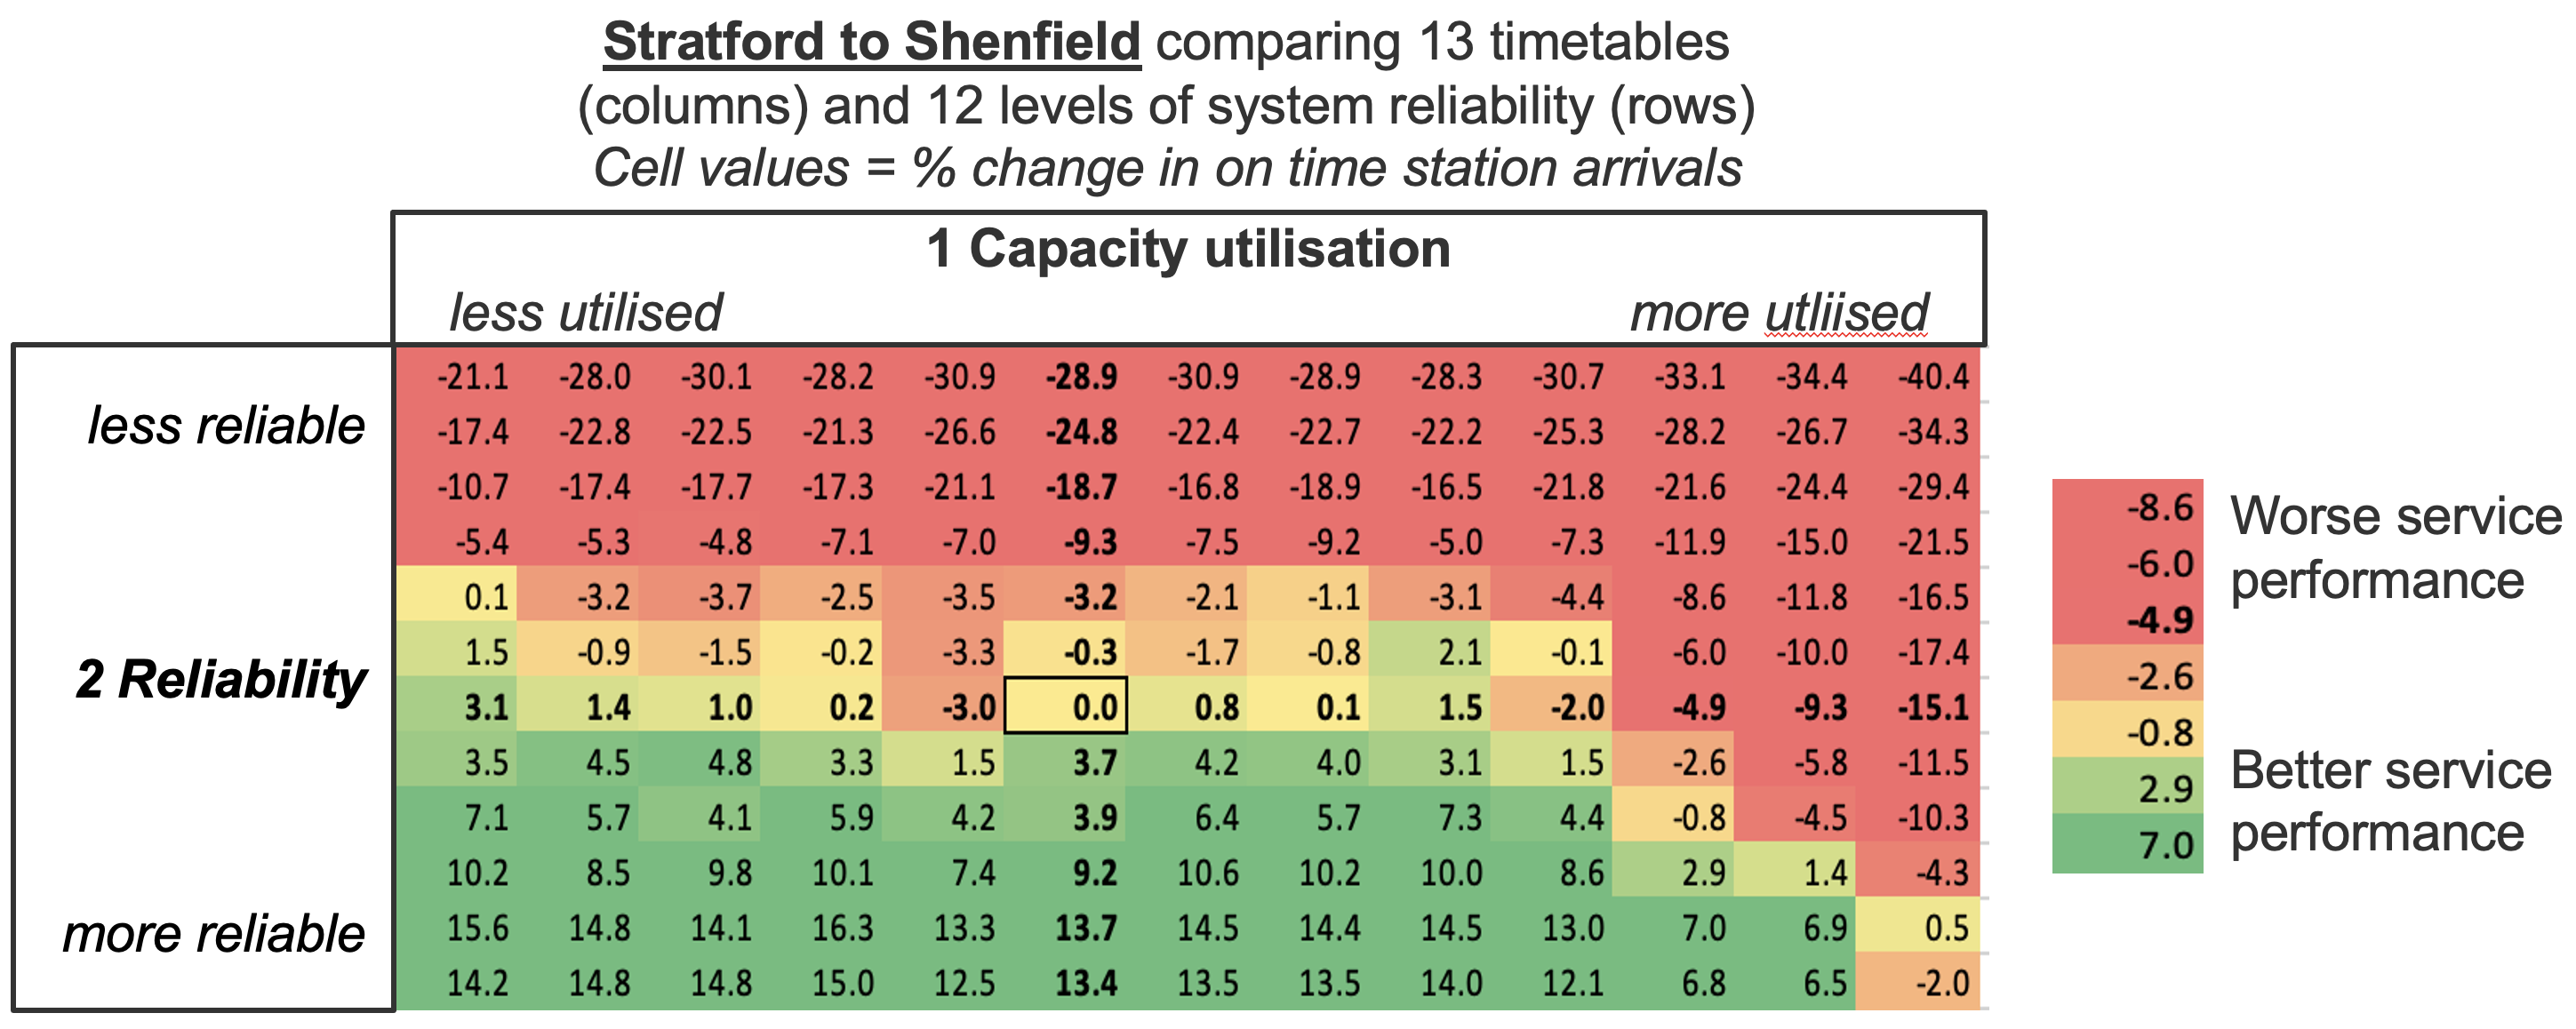
The conditions that create these tipping points should be avoided.
The cell values shown in this table are the average change in on time performance from a baseline model scenario (typical historic system reliability x1.0 and a historic timetable service density) – the cell in the middle of the table. The cells are coloured red to show where performance is significantly lower than the baseline (5% drop). The tipping points are shown by the orange regions of the table.
What operators do with this information
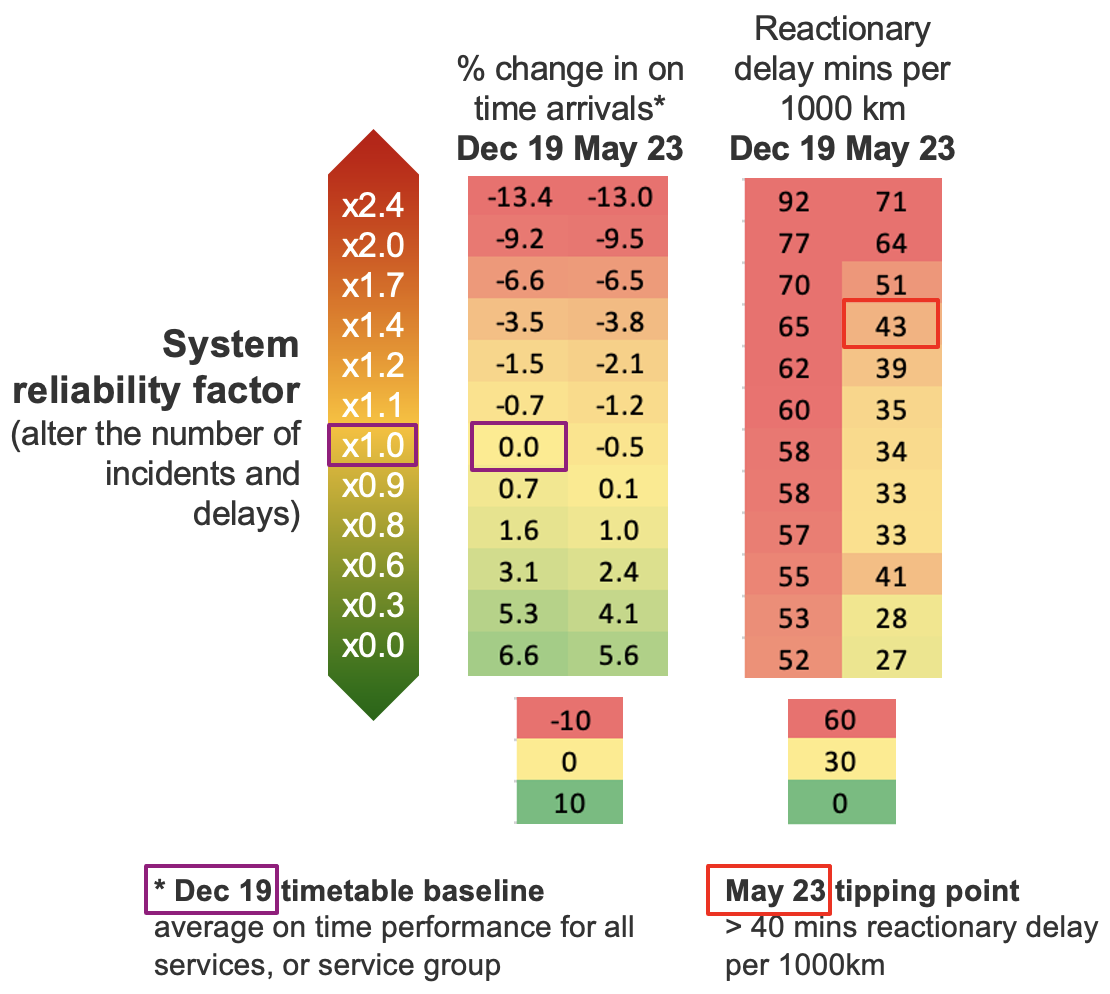
Operators can examine the reliability of a future timetable: The project then applied the insights about tipping points by modelling a new May 23 timetable with increasing levels of incidents and delays. This would identify any parts of the route and periods of the day that experience performance tipping points. The performance of the May 23 timetable under these stress conditions was then compared with the historic December 2019 timetable to identify if the new timetable had any areas of increased risk of poor performance. In other words, the modelling was able to test how reliable the new timetable might be compared with an existing timetable, over a range of stress conditions.
“The standard of the outputs was such that they could be tangibly trusted, and deliver benefit to company and passengers"
Richard Parsons, Planning and Performance, Anglia Route, Network Rail
How this can be used
An existing timetable can be stress tested with increasing levels of incidents and delays to identify the risk of poor performance (how close parts of a route are to tipping points in performance).
Timetables can then be re-designed to be less vulnerable in the face of incidents and disruption. Options include
- changing stopping patterns,
- changing train timings,
- reducing trains per hour,
- increasing network capacity.
For the parts of a route with a higher risk of tipping points, risks can be reduced by finding ways to improve system reliability; e.g. reduce the likelihood or impact of the root causes (incidents or service timings causing conflicts).
Future timetables: In addition, new timetables can be stress tested in the same way, at the design stage, so that they can be modified to reduce the risk of tipping points and poor performance.
Example... Comparing proposed May 23 timetable performance with December 19
We stress tested both the May 23 and December 2019 timetables, with increasing levels of delay and compared their performance. We found it is likely that Greater Anglia services using the May 23 timetable achieve a slightly better average performance than using the December 19 timetable.
The May 23 timetable:
- Is slightly less vulnerable to peak period congestion and lateness
- Is less vulnerable to extended lateness
- Is likely to have fewer days with very poor performance
- Has a reduced likelihood of reactionary delays
The May 23 timetable was operating further away from tipping points. But this overall performance result is hiding variations by route; on closer inspection we have identified that some routes are still likely to be operating ‘in the red’, beyond their tipping points, with congestion in peak periods causing lateness.
“To go out and collect reliable data timing trains would be a hugh amount of work, so when someone provides information that is reliability modelled, using appropriate methods and delivering outputs that are sensible and usable, this is of great value to the industry."
Richard Parsons, Planning and Performance, Anglia Route, Network Rail
To find out more… and see the interactive visualisations in action
contact us: savi@risksol.co.uk